
Empowering Insights: Navigating the Uses and Emerging Trends of Power BI in Business Intelligence
Data has emerged as the lynchpin of well-informed decision-making in today’s quickly changing business environment. Companies are using cutting-edge tools and technologies to turn raw data into useful insights, and Microsoft’s Power BI is one such technology at the forefront of this change. A robust business intelligence (BI) solution called Power BI enables firms to visualize and analyze their data, find trends, and make data-driven choices. In this post, we will examine the various applications of Power BI and the most recent trends influencing the development of this innovative BI tool.
What is Power BI?
Power BI is a business analytics tool that aids in providing insights to enable quick and educated decisions on the collected data. In essence, Power BI is part of the Power Platform, which also includes PowerApps, Power Automate, and Power Virtual Bots. How to use Microsoft Power BI is as follows:
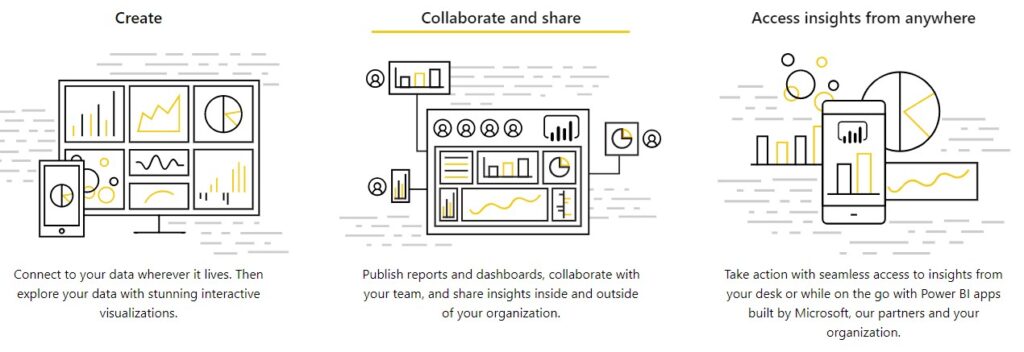
- Create great visualizations from data and share them with coworkers on any device.
- Visually examine and analyze data both locally and remotely in a single perspective.
- Gather the information you require.
- Share and collaborate on interactive reports and dashboards that are uniquely yours.
- automating data collection, data update, data reuse, and other processes
- Scale throughout your company with built-in security and governance.

For most businesses, Power BI delivers robust analytics and reporting features. quicker experimentation with statistical functions, calculations, and visualizations over large datasets, as well as the capacity to quickly combine different fields to arrive at conclusions on the spot. In addition to visualizing your data and disseminating insights throughout your company, Power BI is a business analytics tool that connects to hundreds of data sources to make your data come to life with real-time dashboards and reports.
How Does Power BI Work?
Power BI does not need any complex coding. It operates in the following 3 steps:
Uses of Power BI:
Data Visualization: The key feature of Power BI is its capacity to turn complex data into aesthetically appealing and simple-to-understand reports and dashboards. Users can design interactive visualizations like maps, graphs, and charts that enable stakeholders to quickly understand important insights.
Natural Language Processing (NLP): Natural language processing tools built into Power BI enable users to have natural-sounding conversations about their data. This feature makes it simpler for non-technical people to extract useful information from their data when combined with AI-driven insights.
Mobile Accessibility: Power BI’s mobile app makes it possible for users to see their reports and dashboards while on the road at a time when remote work is becoming more and more common. This mobile accessibility means that decision-makers are not restricted to a particular place and increases flexibility.
Data Connectivity: Users of Power BI can import data from a wide range of sources, including databases, Excel, cloud-based and on-premises data sources, and even web services. Because of its adaptability, it is a crucial tool for businesses working with a variety of data kinds.
Data Modeling and Transformation: Users can utilize the tool’s robust data modeling features to sculpt and change their data. Users of Power BI’s Power Query Editor can clean, manipulate, and integrate data from many sources to make sure it is prepared for analysis.

Collaboration and Sharing: Power BI makes it easier for teams and organizations to collaborate effectively. Users can collaborate on reports in real time thanks to the integration of Microsoft 365 and the ability to share reports and dashboards. Transparency and group decision-making are improved by this collaborative atmosphere.
Latest Power BI updates and features you need to know.

Artificial Intelligence and Machine Learning Integration:
The incorporation of machine learning and artificial intelligence is one of the main trends in Power BI. With the help of machine learning, Power BI now offers a function called “Quick Insights” that finds patterns and insights in data automatically. For analysts who would otherwise have to manually search for insights, this function can save a significant amount of time. The tool’s integration with Azure Machine Learning additionally enables customers to perform advanced analyses of their data, including forecasting and anomaly detection.
Augmented Analytics:
In the BI landscape, “augmented analytics,” which uses machine learning and AI to improve data analytics procedures, is gaining popularity. To simplify data preparation, insight discovery, and the creation of useful insights, Power BI is integrating augmented analytics tools.
Real-time data visualization
The ability to view data in real time is another trend in Power BI. The tool’s connection with Azure Stream Analytics enables users to stream data from numerous sources and view it in real time, which makes this possible. Businesses like e-commerce companies and financial institutions that need to make quick choices based on real-time data will find this capability to be very helpful.
Natural language query
Users may now ask questions in natural language about their data using the “Q&A” functionality that Power BI has included. This tool creates a visual depiction of the solution using machine learning to comprehend the query. This facilitates access to and understanding of the data by non-technical users, which is useful for companies with a high number of stakeholders.
Mobile support
With the addition of mobile device support in the most recent version of Power BI, customers can now access and engage with their data while on the road. The sales and marketing teams who need to access data while traveling will find this to be extremely helpful. The mobile app has the same features and functionality as the web version and is accessible on both iOS and Android devices.
Cloud integration
Microsoft’s cloud platform Azure serves as the foundation for Power BI. Users may now connect to a variety of cloud-based data sources, including Azure SQL Database and Azure Data Lake Storage, with ease. Additionally, customers are now able to exchange and work together on reports with colleagues within their company, regardless of where they are located.

Custom visualizations
Power BI’s ability to build custom visuals is another trend. With the help of the JavaScript-compatible Power BI Custom Visuals SDK, users of the tool can make their visualizations. This enables developers to produce visualizations that are customized to the unique requirements of their organization.
Conclusion
In the area of business intelligence, Power BI has emerged as a disruptive force that enables enterprises to fully utilize their data. All sizes of businesses favor it because of its user-friendly interface, powerful capabilities, and seamless connection with other Microsoft products. The next stage of Power BI’s evolution is being shaped as we look to the future by the integration of AI and ML, enhanced analytics, and a focus on data governance and security. Businesses may use the full potential of this BI tool to achieve a competitive edge in a world that is becoming more and more data-driven by keeping up with these developments.